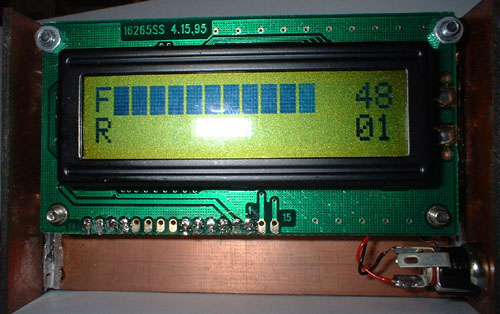
Front view of the display showing bar graph and power
QRP Wattmeter
Front view of the display showing bar graph and power
I decided that I needed a wattmeter to complete my QRP station and started looking at different published designs.
The Stockton Bridge design, published in the GQRP Antenna handbook, looked a simple solution for the sensing element, so I started
to look around for suitable panel meters to complete the project. It soon became clear that meters have become expensive, whereas
an LCD display might be actually be less expensive and more robust.
This set me off considering how to interface the LCD display to the Stockton Bridge sensor and I turned my attention to PIC microprocessors.
The PIC16C71 microprocessor offers a four input Analogue to Digital converter, which I could use to read the voltages from the sensor and
enough interface pins to drive an LCD display.
My in my final solution I used a 16 character by 2 row LCD module, diplaying forward power as a bar graph on the top row and reflected power
on the bottom row. I also decided to display the absolute value read from the sensor as an indication of the power levels.
The PIC made it possible to scale the display for near full scale irrespective of the power applied, which made it easier to use when tuning up.
The output from the Stockton Bridge is non-linear, as one might expect. Testing with my FT817 at different power levels gave 17 for 0.5 Watt,
48 for 2.5 Watts and around 75 for 5 Watts. No attempt has been made in the software to linearise the display on the LCD.
Since the Analogue to Digital converter in the PIC can read up to 255, I suspect that it will be possible to use the wattmeter up to at least
10 Watts, for those interested in QRO, but it would be advisable to increase the power rating of the 50 Ohm resistors in the sensor as they can
dissipate full power under mismatched conditions.
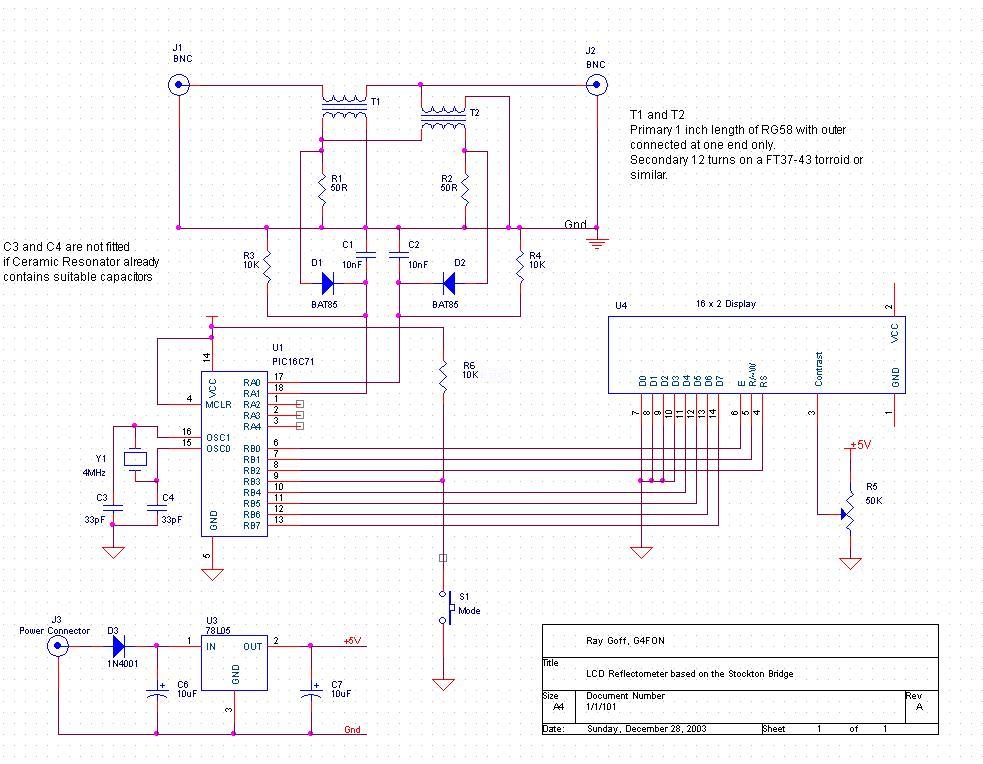
Schematic
The circuitry around the Stockton Bridge was kept as short as possible. The two transformers consist of a secondary of 12 turns on a FT37-43 torroid, with the primary being a short length of RG58 coax with the screen left unconnected at one end. The primary of T1 connects between the BNC connectors and the primary of T2 connects between R1 and R2. This can clearly be seen in the picture below.
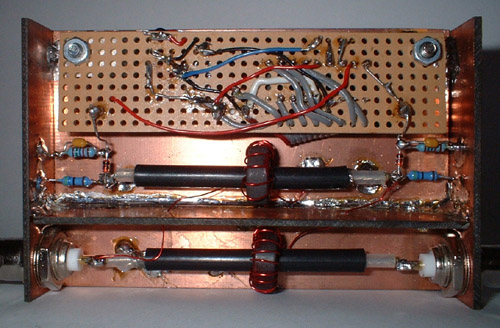
Rear view showing the sensor and the strip board holding the microprocessor
The software has been updated to include a Mode switch which flips between the bargraph display and a calculated SWR reading. Press and hold down the Mode button to switch between modes.
See the schematic above for details on how to connect the Mode switch.